
Bob Veres of Inside Information (https://bobveres.com) wrote about Income Lab in his July newsletter to his subscribers. Here’s what Bob had to say about Income Lab:

Modeling Market Disasters
Synopsis: Income Lab’s new feature makes it possible for advisors to provide clarity about how their retiring clients would be impacted by difficult market conditions.
Takeaways: Interestingly, in some scenarios, clients who would have scored lower on a Monte Carlo rating would have received consistently higher income during some market downturns than those who opted for a 90% success rate.
I’m sure that you, like me, have been reading about the limitations of the Monte Carlo retirement sufficiency calculations—i.e., you have a 74% chance of meeting your retirement goals.
If you haven’t been reading the skeptical literature, the gist of it is, first, that this statement presupposes a level of precision that doesn’t actually exist. (Not 73% or 77%?) Second, the Monte Carlo engine that you get from our traditional planning software packages doesn’t account for reversion to the mean. Some of the 1,000 or so outcomes it’s mapping (including at least a few of those 26% failures) are simulations where the software pulls a 1974 followed by a 2008, followed by a 1929, and then a 2001 and 2002, and then maybe a 1939.
In the real world, once stock prices drop down near zero (as they would with that lovely market sequence) buyers eventually rush in, the economy would recover a bit and you would get some positive returns mixed in with the negative ones.
And then there’s the biggest objection to Monte Carlo, which is that it is a binary output. Meaning: a plausible reading of the numbers would suggest that you will either meet your retirement goals or you will fail. Fail!? What does that mean? The client’s likely assumption is that there’s a 26% chance that she’ll spend her golden years sleeping under a bridge at night after a sumptuous dinner of cat food.
With that picture in mind, the client is likely to push closer to a 95% degree of certainty, which will almost inevitably lead to diminished lifestyle spending in retirement and (in most real-world cases) a lot of money going to the heirs. The retirement conversation very quickly became dysfunctional.
Clients might assume that ‘failure’ in a Monte Carlo model means something truly catastrophic, instead of a belt-tightening.
Is there a better way to have that conversation? I’ve recently been looking at some new features in the Income Lab software program (https://incomelaboratory.com/), which might help clients put ‘success’ and ‘failure’ into better perspective.
Income Lab has always one-upped Monte Carlo in retirement sufficiency sophistication. Like the planning programs, it collects a client’s various retirement portfolio balances, and suggests a sustainable monthly or yearly spending capacity. But in addition, it incorporates some modifications to Monte Carlo to account for the tendency of the markets to eventually self-correct, and it models (if you want it to) for the retirement income ‘smile,’ where clients will be more likely to spend more on things like travel and entertainment during the vigorous early years of their retirement, gradually less as they get older and more sedentary, and more again as we all experience greater healthcare-related expenses.
The program also accounts for the sources of income, which can be important. If the client is living on a generous pension plus Social Security plus income from a rental property, with only a small equity portfolio, then market volatility is not going to have a big impact on how much he can spend. If, on the other hand, a client’s income is coming from a decumulating portfolio exposed to the markets, there will be proportionately more uncertainty. Some of that can be tamed by dialing up or down the risk asset portion of the portfolio, and that, by itself, can be a productive conversation with clients.
In addition, the program will go ahead and calculate multiple different after-tax ways to decumulate, although the ‘winning’ strategy is almost always filling up the lower tax brackets each year through Roth conversions or taking taxable gains in the years before the RMDs kick in.
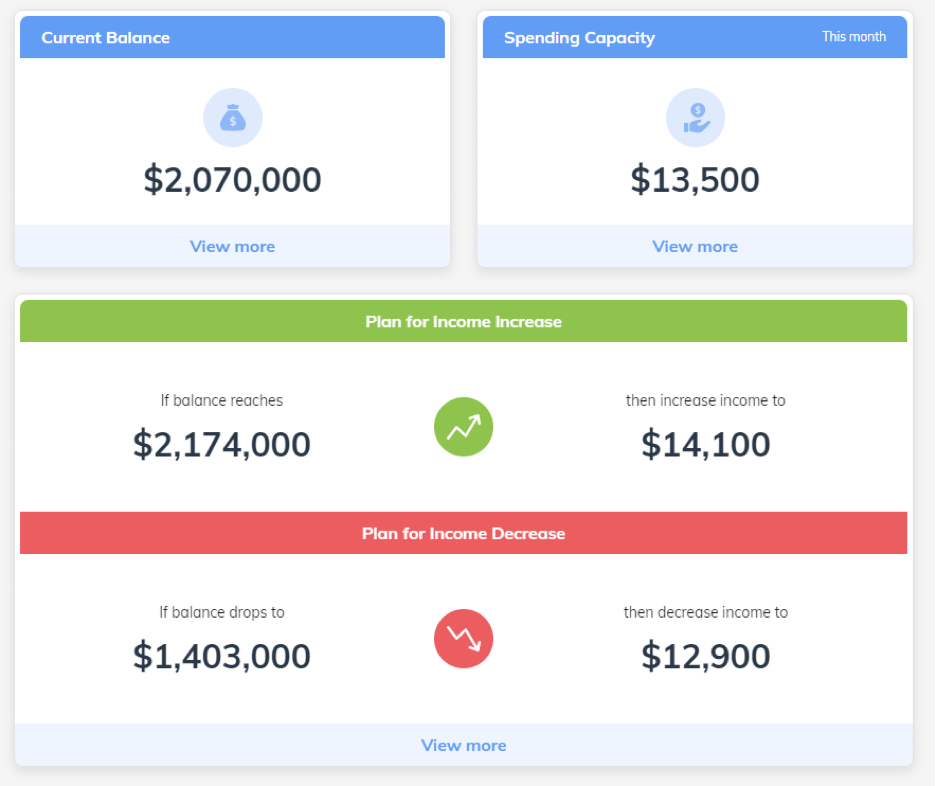
Finally, Income Lab will offer clients a guard rail proposal. (See first and second images above.) It starts by proposing a plausible annual income that clients can take out of their portfolio—in this case, $13,500 a year from a roughly $2 million retirement portfolio, all of which is exposed to the markets. (As you’ll see in a moment, the program accounts for Social Security income from this retired couple.) The client can see how, if the portfolio were to breach an upper threshold, his income would go up to just over $14,000 a year. But in an unfortunate market where the portfolio declined by more than 30%, the income would have to be cut back to $12,900 a year.
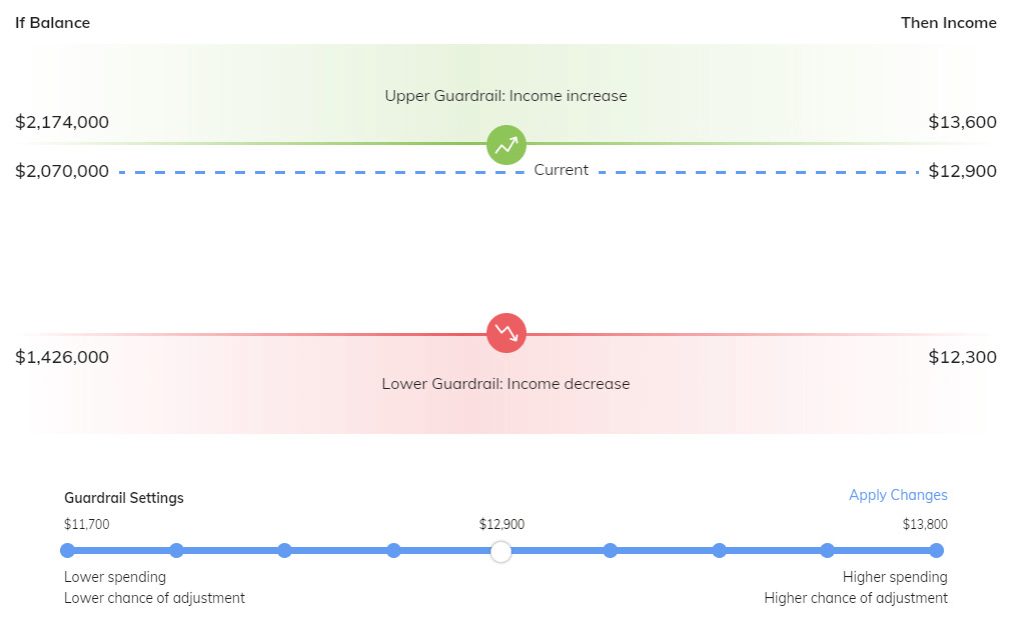
This is illustrated graphically in the second output (previous page, bottom), and here a client who is uncomfortable with the software’s recommendation can use a slider to dial up or down the amount of monthly or annual income they will take. Moving the slider to the left dials down the annual income and, accordingly, moves the dotted line lower and reduces the chances that the income will have to be adjusted if/when the markets go down. This also, of course, increases the chances of a pay increase if/when markets go up. Moving the slider to the right raises the income level and also the chances of a downward adjustment—but inevitably, the client will be surprised at how much the market would have to decline to have a real impact on lifestyle spending.
This is a teachable moment that Monte Carlo tends to leave out.
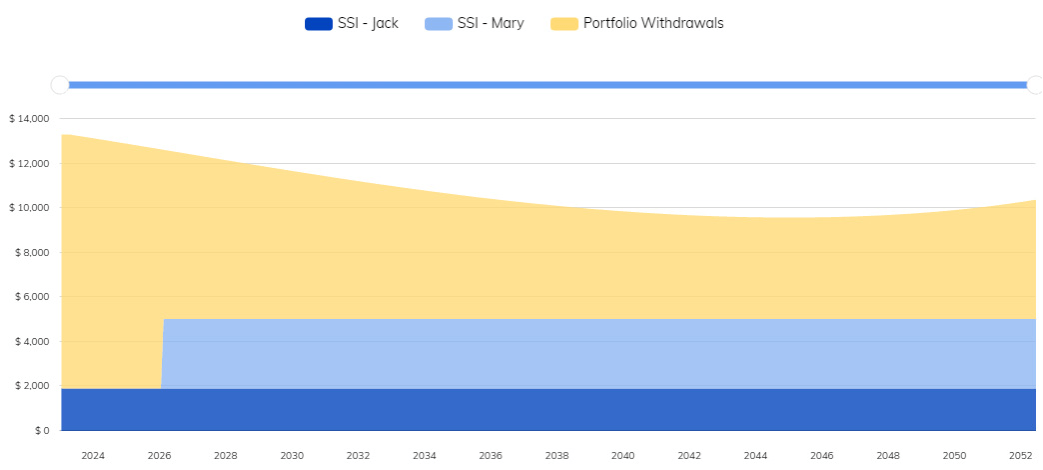
The third image (above) shows the sources of income—in this simplified example, Social Security for the respective spouses and the retirement portfolio —and it also shows the retirement income ‘smile’ that is generally more effective at modeling client retirement income needs than the more traditional straight line indexed for inflation. You can, as mentioned earlier, turn off the smile and offer clients the more traditional linear spending amount indexed to inflation.
These deeper dives into the various possibilities creates the opportunity for a conversation that isn’t really facilitated by the traditional Monte Carlo output. Would you (Mr. and Ms. Client) be okay with tightening your belt to that extent if the market were to go down that much? No? Let’s move the slider a little bit to the left, where the proposed income (shown here as the ‘spending capacity’) drops a bit. Yes? Or would you like to take more income and accept greater risk of cutting back in market decline scenarios?
If you use nothing more than those outputs, you can facilitate a productive iterative conversation where the clients might go back and revisit their retirement portfolio’s asset allocation and income needs to make the numbers feel more comfortable.
But I’m sure at least some readers are saying to themselves: ‘Okay, but that still seems kind of hypothetical. Does the client actually understand how those proposed market movements relate to the real world?’
And you’re right; even at this level of deeper analysis, a client is likely to have a limited idea of how much he/she would have to tighten, or for how long, before the markets recover.
Couldn’t we give the client a quick look at some worst-case scenarios from actual market events, and see how these allocation and decumulation decisions would play out if they were to happen again?
Now you can. That’s the new feature that I want to explore.
Great Recession
Income Lab’s new ‘Income Experience’ feature makes it possible for advisors to say, for example: Let’s suppose you were following this guardrail plan that we’ve selected, and, God forbid, you were to retire right before the Global Financial Crisis, otherwise known as the Great Recession market meltdown, that started in November 2007. What would your monthly income look like under a pretty awful market scenario?
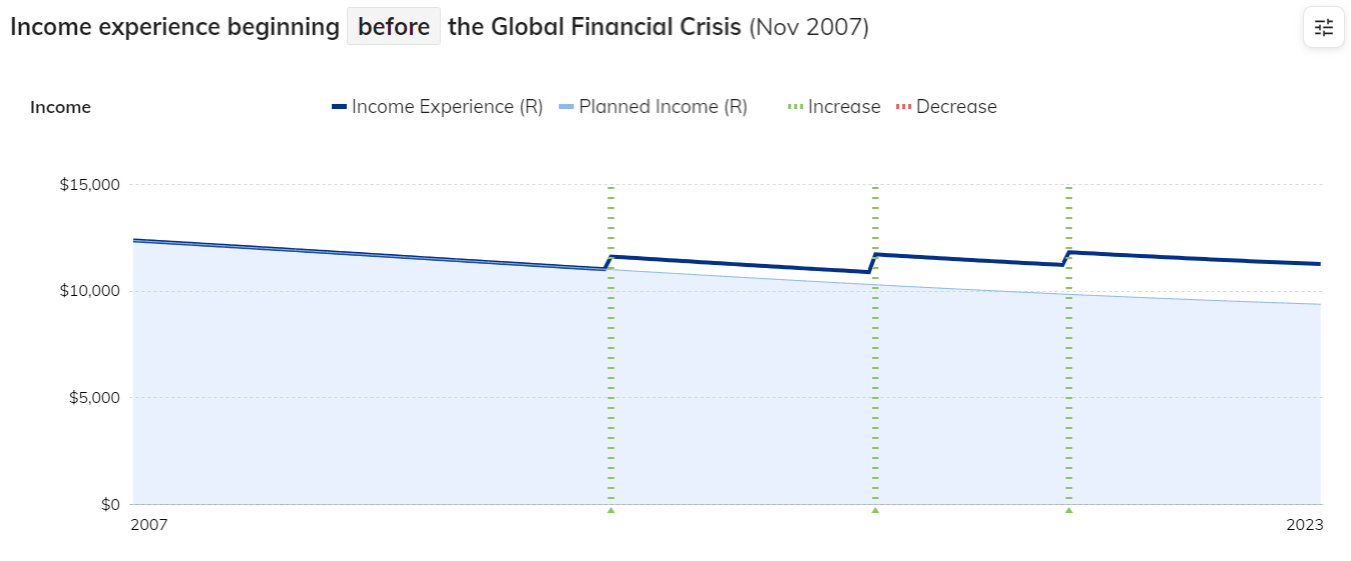
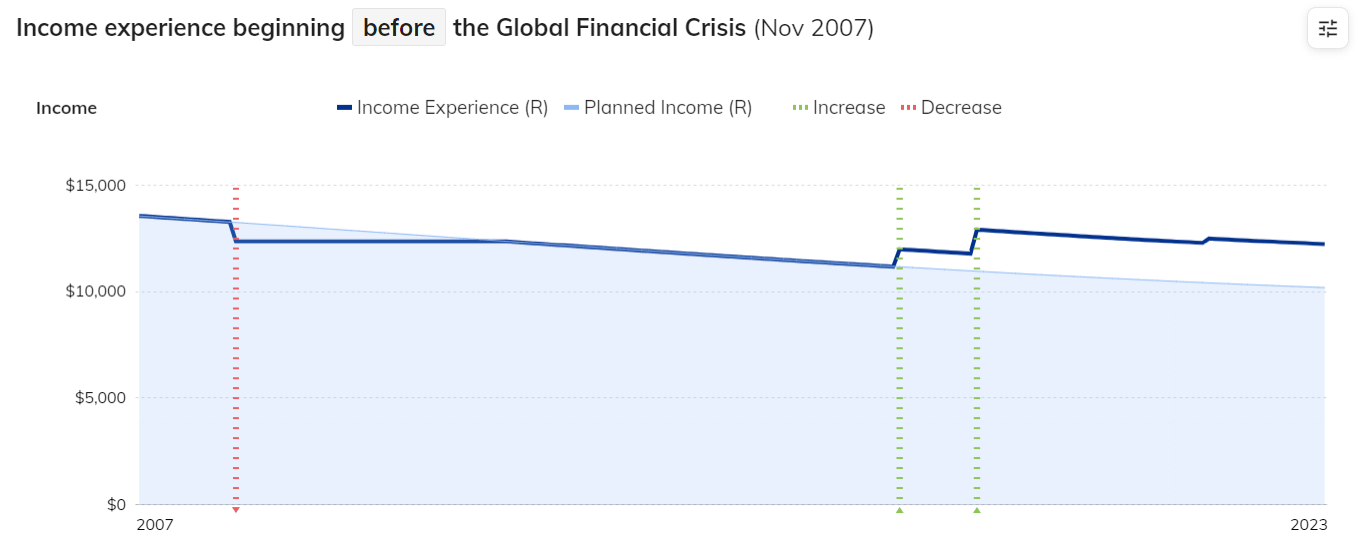
The first illustration (top, right) shows the same hypothetical investor’s income experience line in dark blue, compared with (light blue) the anticipated income based on the plan that the advisor and client agreed on. This is a scenario where the client accepted Income Lab’s $12,900 monthly income recommendation, but dialed down the retirement portfolio’s stock percentage to 35%.
You can see the income expectation for the first 16 years, sloping downward incrementally due to the first leg of that retirement spending ‘smile.’ The good news is that this client would not have to suffer a diminution of income in those awful early years. Then, during the recovery, there would be three pay increases in the ensuing (still early) retirement years.
The second figure, below, shows what would happen for a client who was more inclined to shift that slider to the right. This client’s portfolio, with the same initial conditions, is 75% allocated to stocks, and the client is taking $14,000 a month in income initially.
Oh dear. The following year, as the global financial crisis slammed into the portfolio, the client would have to cut back his/ her income a few hundred dollars a month. It would be roughly five years before the guard rails allowed the income to get back up to the projected levels.
But then (remember?) the market recovers, and the client is able to take three different spending increases (the last one is almost too modest to mention) that result in higher income than the more conservative client was able to take. In fact, every year, this client is taking out more income than the more conservative client did. Does Monte Carlo offer that kind of insight?
Hopefully, the illustration will help clients put the chances of cutting their income in perspective and generally show how the whole guard rail concept works under the most stressful market conditions. My personal takeaway is that trying for a 95% success rate in the traditional Monte Carlo measurement is actually a pretty darned dysfunctional way to plan for my retirement future.
Stagflation
The Income Experience feature also models some other nasty market situations.
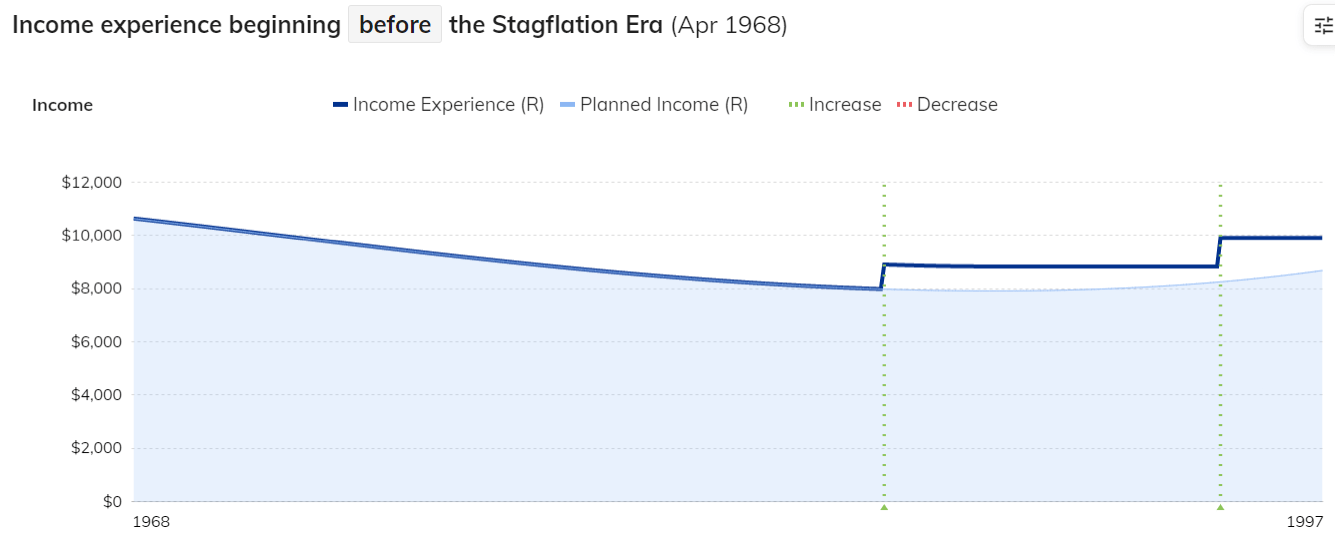
One of the most stressful markets in the Bengen research, the one that actually defined his initial 4% rule (every other time period was more successful than this one) is the so-called ‘stagflation era.’ The person who retired in the spring of 1968 would have suffered less market trauma than the 1929 crash and the ensuing Great Depression, but the market doldrums from 1968 through the early 1980s were accompanied by high inflation, which required more monthly spending to maintain the same lifestyle expenditures.
To show clients what their Golden Years would have looked like during this historically bad time to retire, you plug in the same income plan and guardrails, and you get the top illustration to the right, showing, once again, the income experience as a dark blue line, and the expected income under the plan in light blue.
In this first illustration, Income Lab is modeling the outcome for that conservative client whose portfolio was 35% allocated to risk assets and is taking out $11,500 in annual (inflation-adjusted) income. (This lower income amount is roughly equivalent in spending power for that era to the $13,500 income in ours.) Once again, we see that retirement ‘smile,’ and once again we see that the lower-end guardrails were never breached. The long bull market that started in 1982 allowed for a couple of somewhat cautious spending increases.
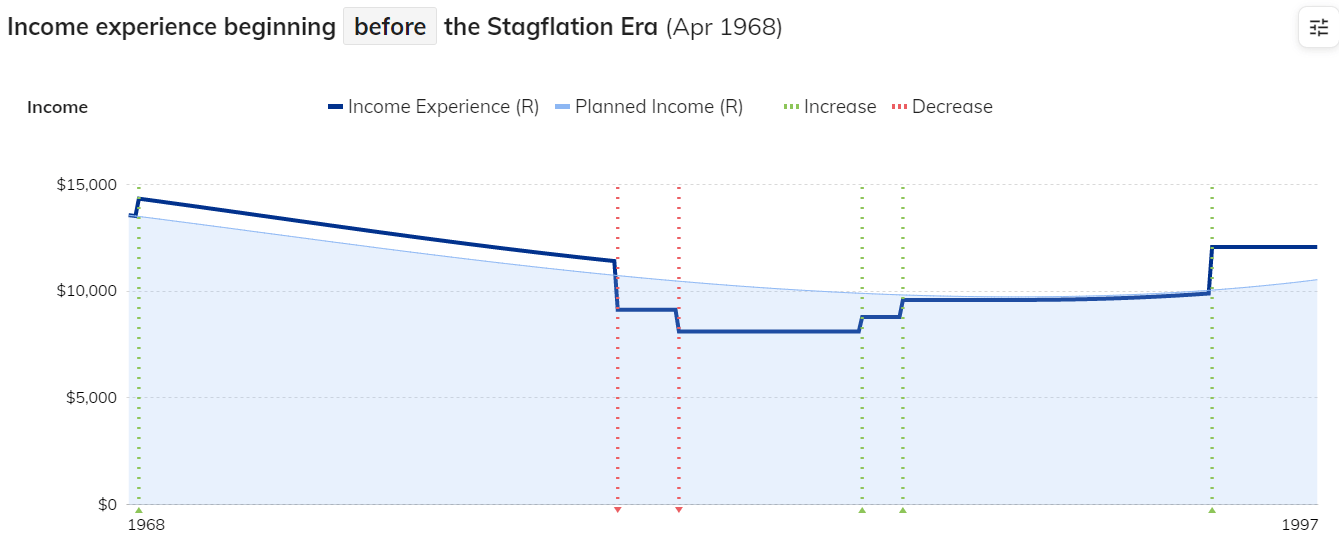
The second illustration maps out the more tumultuous experience of that client who has the risk tolerance to accept a portfolio with 75% exposure to equity assets, and who committed to a more adventurous monthly income of roughly $14,000. Notice there’s a small income increase in the first year, and then two decreases that would have taken monthly income down below $10,000, and then below $9,000, before crawling back up out of the hole in a couple of steps to the expected levels. Finally, there’s a nice increase in income as the portfolio experiences the bull market of the 1990s. This illustration might make the confident, high-risk-tolerance client pause, but once again there are only a few years when the retired person would have to tighten his belt.
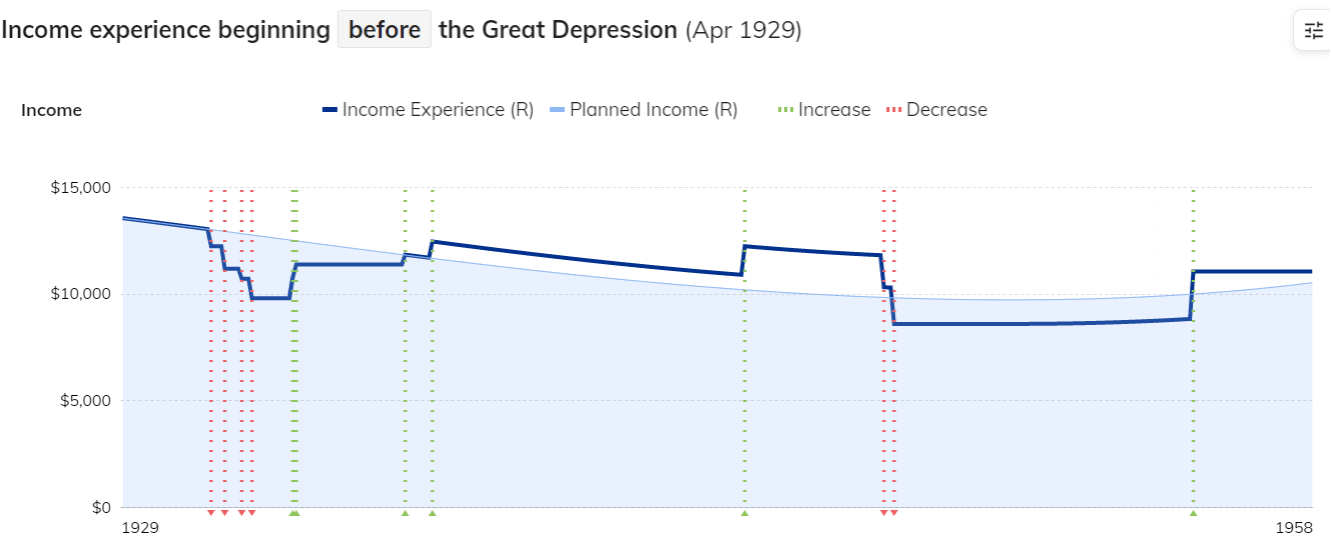
Great Depression
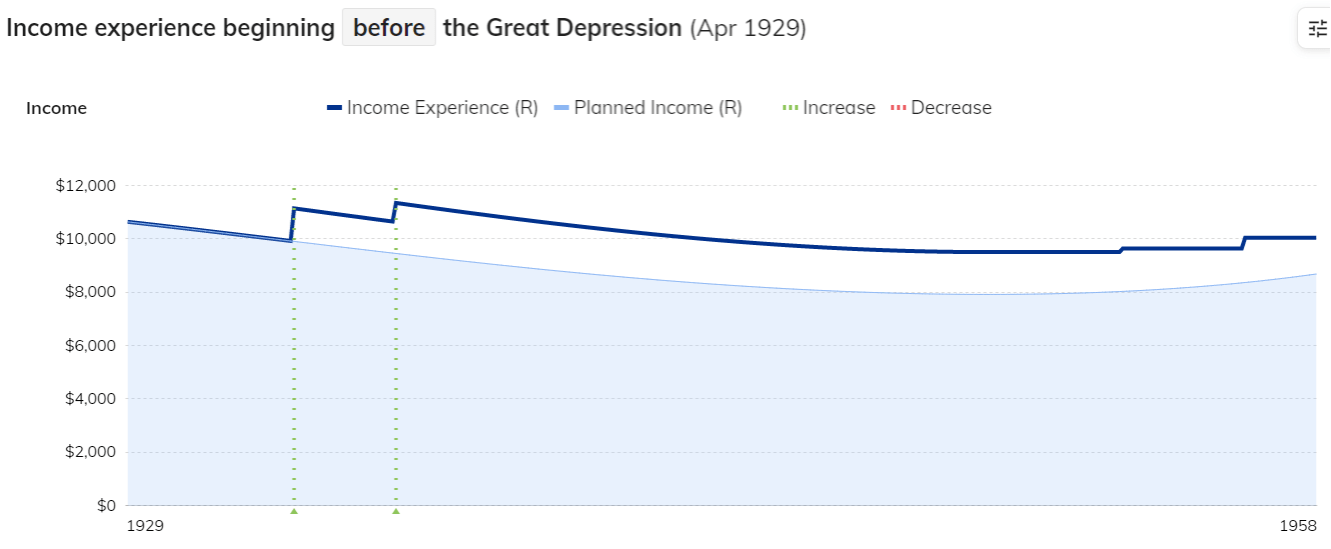
The final illustrations show the client experience, same plan, if the client had retired in April 1929, which astute students of history will recognize as right before the Great Depression-starting crash later that year. The conservative client not only sailed through the awful markets (greatly aided by deflation and the rising value of the bond portfolio) but was able to increase income early in that disastrous period of market history—not once, but twice, and then (by small increments) twice again in the 1950s.
The more adventurous client would have experienced a more tumultuous ride during his Golden Years. He would have had to tighten his belt over and over again in the 1930s but emerged with higher-than-projected income during the war years, only to do another round of belt-tightening before the markets recovered and provided a retirement pay raise in later years. But notice that there were only a few years where this client was taking less income than the more conservative one. The main difference was the fact that the second client had to make more (and more significant) adjustments to achieve the higher overall income.
Before long, the Income Lab software will allow advisors to input any combination of years, and see the prospective results of client portfolio and income decisions. But I think just a couple of illustrations makes exactly the point that clients need to see: that if they were to retire at the worst possible times in market history, they wouldn’t be eating cat food under a bridge, and that they can tweak the plan to the point where they might never have to take a pay cut in retirement at all. Alternatively, they can make a decision to weather periodic pay cuts in order to experience higher income levels overall.
And I think the main point here is that under traditional Monte Carlo, many of these scenarios would have led to ‘failure.’ Under the guardrail plan, the belt-tightening, should it happen at all, tends to be temporary and not especially painful. That might be something worth showing your clients who are anxiously wondering if they have ‘enough.’

Continue Reading
Ready to see this in action?
Watch how Income Lab helps advisors answer clients' toughest retirement income questions with guardrails-based planning.
Book a Walkthrough Start Free Trial