
In the last two weeks, the U.S. Department of Labor has released the highest weekly initial unemployment claims numbers on record. Almost 10 million Americans filed for unemployment over a two-week period at the end of March. To put these numbers in perspective, the previous weekly high was 695,000 in September of 1982. The Great Recession saw a peak in new claims of 639,000 in April of 2009. In other words, the size and pace of new unemployment due to the COVID-19 pandemic is staggering, and we may be only at the beginning of this unemployment spike.1
Initial Unemployment Claims
- March 21, 2020– 3.3 million
- March 28, 2020– 6.6 million
- April 13, 2000 – 639,000
- Sept 27, 1982 – 695,000
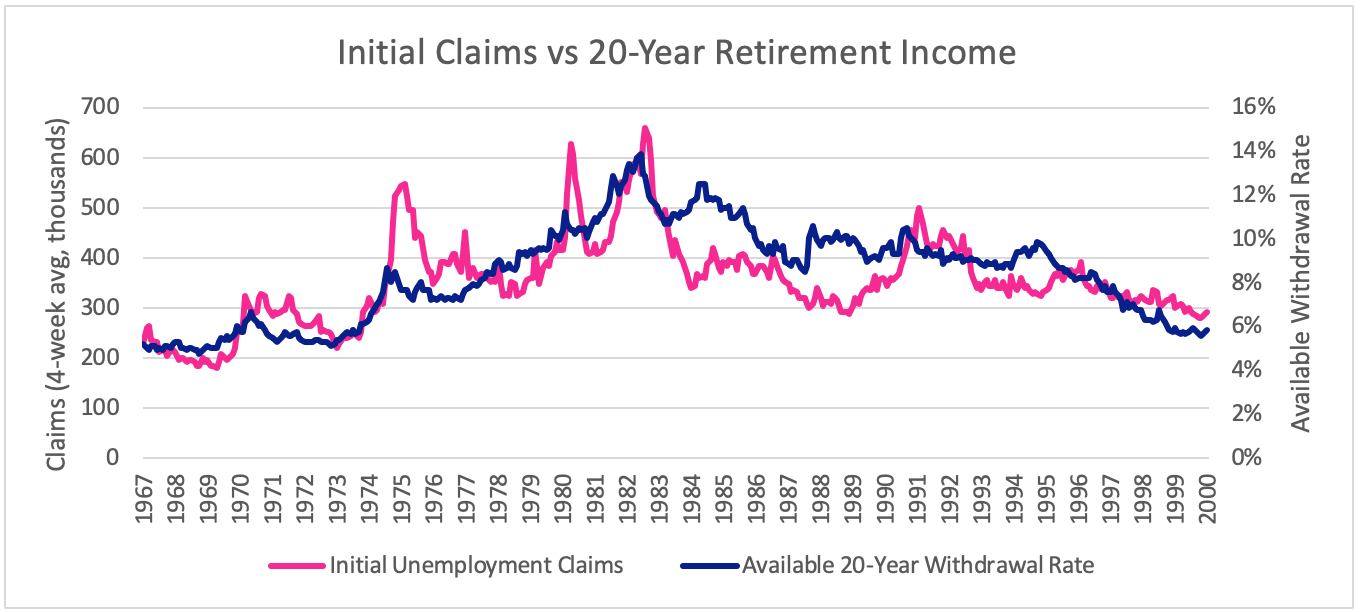
Those in retirement may not have just lost employment, but It is natural to ask what these sorts of gloomy economic headlines might mean for retirement income planning. It turns out that, historically, initial unemployment claims do hold information that is useful for retirees who support their retirement income with portfolio withdrawals. Though data is somewhat limited (initial claims data is only available since 1967), the four-week rolling average of initial claims has between a 61% and 83% correlation to available withdrawals for retirement income, depending on the amount of time that income must last.2

For example, available 20-year withdrawal rates peaked at around 14% just two months before the peak in initial claims in 1982. Compared to a median available withdrawal rate of 8.8% over the period shown (and a low of 4.8%), we know in retrospect that 1982 retirees had access for a short while to withdrawal rates that were 59% higher than usual.
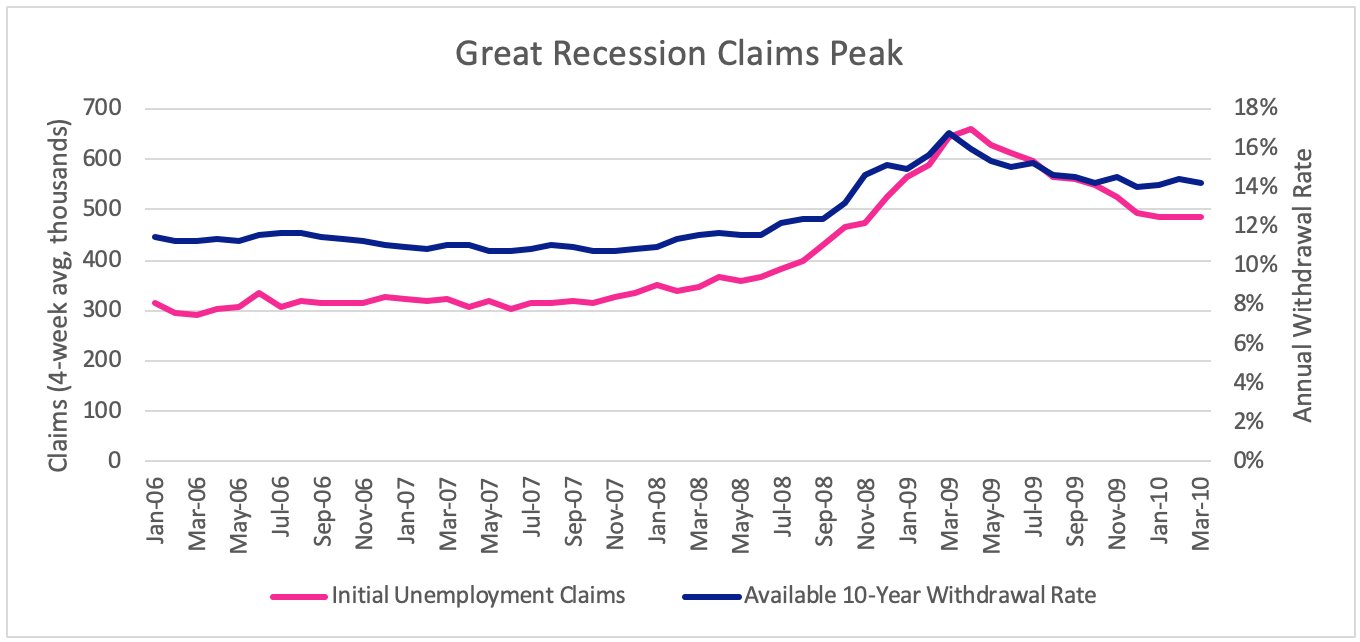
A similar matching of peaks was seen in the financial crisis. (Since only 11 years have passed since 2009, we use available 10-year withdrawals here.)
Of course, correlation is not the same as causation. These high correlations are probably best explained by the tendency of initial unemployment claims to peak (almost by definition!) just as things start to get better economically. These unemployment claim peaks can be close to points when securities prices reach a low point. And we know that available withdrawal rates are highest just after these market low points. Historically, sequences of returns following market bottoms are very advantageous for retirees.
Though the current environment seems bleak, it’s important to remember that the same was true at previous points when unemployment spiked. But with hindsight, we can see that things were darkest before the dawn. For example, after 1982, future investment returns would have more than made up for the market losses that had been suffered around the time of that spike in unemployment claims, and retirees would have been rewarded for staying the course. The same is true for the Great Recession.
Typically, statistics that tell a tale of economic woe hold within them a message of hope for retirement income. Though spikes in unemployment claims usually coincide with periods when nest eggs shrink, they have never in the past required retirees to reduce their income in proportion with their losses. If the past is any guide, these peaks are also when the withdrawal rates available to retirees are highest. These countervailing forces can provide significant cushion to income in tough times.
1. In future Lab Notes we’ll track the unemployment rate as well, which lags behind new claims statistics.
2. P-values for the null hypothesis that there is no relationship between available withdrawal rates and initial claims are vanishingly small. Available withdrawal rates are based on gross returns from a generic 60% stock/40% bond portfolio with monthly withdrawals adjusted for inflation. Results would vary for other withdrawal plans and other portfolios. Past performance does not guarantee future results.

Continue Reading
Ready to see this in action?
Watch how Income Lab helps advisors answer clients' toughest retirement income questions with guardrails-based planning.
Book a Walkthrough Start Free Trial