
The analytics behind today’s retirement plans focus on how things might work out if a given set of choices (investment allocations, portfolio withdrawals, cash flows, etc.) are carried on into the future without change. But this static approach to planning is a crude and ineffective way to meet the two major goals most retirees share:
(a) Maximize standard of living in retirement
(b) Leave a legacy / maintain a financial safety net
The proof of static planning’s failure can be found in plain sight in one of the charts most familiar to today’s financial planners: a graph of possible outcomes if a static plan is followed.
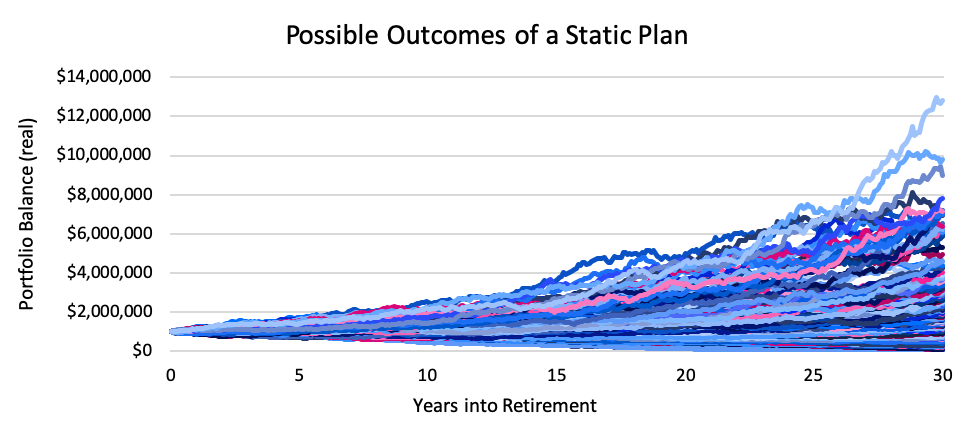
Source: Inflation-adjusted (real) portfolio balances for a 1000-scenario Monte Carlo simulation of a $43,000/year inflation-adjusted income taken from a $1 million 60/40 stock/bond portfolio.1
The range of possible outcomes that could result from following a static plan is huge, ranging from the stratospheric (over 50% of scenarios ended with over $2 million, with a maximum of $12.8 million left over) to the dismal (running out of money). Let’s be clear: both outcomes are a type of failure. In the outcomes that ran out of money this plan clearly failed both the standard of living and legacy goals. But in scenarios that produced an outsized legacy, these retirees skipped income that could have improved their standard of living, thus failing to meet goal (a).
A plan that has this range of outcomes is simply a bad plan. To follow this static plan would be like setting out on a journey to the moon knowing that you might end up burning up in the sun or landing on Neptune. Luckily, just as with a lunar landing, a retirement journey allows for course corrections along the way. And those course corrections allow retirees a much higher likelihood of meeting or even exceeding their goals. But in order to implement intelligent course corrections, we need to abandon static planning. Dynamic plans would not only include a set of behaviors for today, but consideration of how to adjust as time goes on and circumstances change.
To demonstrate the value of dynamic planning, we simulated the retirement experiences of couples who began their retirement at every monthly point in the last 130 years. These retirees began with a relatively conservative income level and reevaluated their entire situation every month as they moved forward in time. This included looking at changing longevity expectations, portfolio balances, purchasing power, and the risk of their income level. Each couple got an income increase if risk went down significantly and a pay cut if risk went up significantly. Other than these risk-based changes and adjustments for inflation, they kept income steady.2
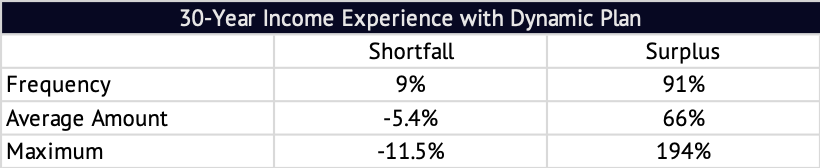
In this study, 91% of simulated retirees experienced more income than they had originally planned for. On average, these retirees received 166% of their originally expected income over 30 years. At the high end, the retirees from July of 1982 ended up with 294% of what they had planned for.
But not all scenarios were positive: 9% of scenarios received less total income than originally planned. On average, though, this shortfall was just 5.4% (94.6% of expected income). On the low end, November 1965 retirees received 88.5% for their originally expected income.3
In all cases, overall retirement experiences showed a reasonable balance between the goals of maximizing standard of living and maintaining a legacy or safety buffer. (No test scenario resulted in portfolio failure.) Different dynamic plans would have different outcomes, but the overall patterns are clear: dynamic plans improve retirement income and the ability to meet goals (a) and (b).
It’s time to abandon unrealistic, static planning and embrace a more realistic, dynamic approach.
1. Assumptions based on the 30-year average gross monthly returns and standard deviations of S&P 500 Total Return Index and SBBI Intermediate Term Government Bond Index through January 2020. Arithmetic average monthly returns: 0.66% (stock), 0.23% (bond). Standard deviations: 3.43% (stock), 1.23% (bond). Correlation: -0.28.
2. Specifically, each couple began retirement with income that had a 90% chance of being sustainable through their plan (a 10% risk level). Couples increased real income if the risk of their income reached 0% and decreased real income if the chances of maintaining their income level went down to 25%. Risk was measured as the chances that a given income amount would survive the full remaining plan length, adjusted for then-current longevity. Couples adjusted their income only when nominal income changes were 5% or more.
3. We also ran this study using different initial retirement income levels, both higher and lower than the baseline case reported here. As expected, starting retirement with a lower income reduced both total income received and the chances of a pay cut during retirement. A higher initial income results in higher total average income and a higher chance of a pay cut sometime during retirement.

Continue Reading
Ready to see this in action?
Watch how Income Lab helps advisors answer clients' toughest retirement income questions with guardrails-based planning.
Book a Walkthrough Start Free Trial